
ValcoMD Market Conditions Update Baltimore / Washington DC Metros:
June 2026 Housing Market Update: The DC Metro median sales price rose 3.0% to a record high of $680,000, much of this can be attributed to low active inventory which is down 45% from 2019 levels, showings up 2.1%, pending sales increased 0.2%, closed sales gained 8.7%, active inventory increased 5.4%, new listings fell 4.9%, months of supply grew to 2.65, and days on market was a very low 8.
The Baltimore Metro median sales price also rose 4.9% at $430,000 to a record high, pending sales rose 1.7%, closed sales fell 3.9%, active inventory rose significantly to 16.1%, new listings rose 1.5%, months of supply increased to 2.42, and days on market at a surprisingly low 8. Activity in the higher priced suburbs fueled much of this increased SP$.
Stats within Maryland for May 2026 vs 2025 which saw $454,000 median SP$ increase 3.2%, pending sales grew from 6,660 to 7,298, active inventory fell from 18,402 to 15,392, new listings also declined from 9,368 to 7,295, closed sales fell from 6,515 to 6,331, months of supply fell to 2.8, and days on market a very fast 10.
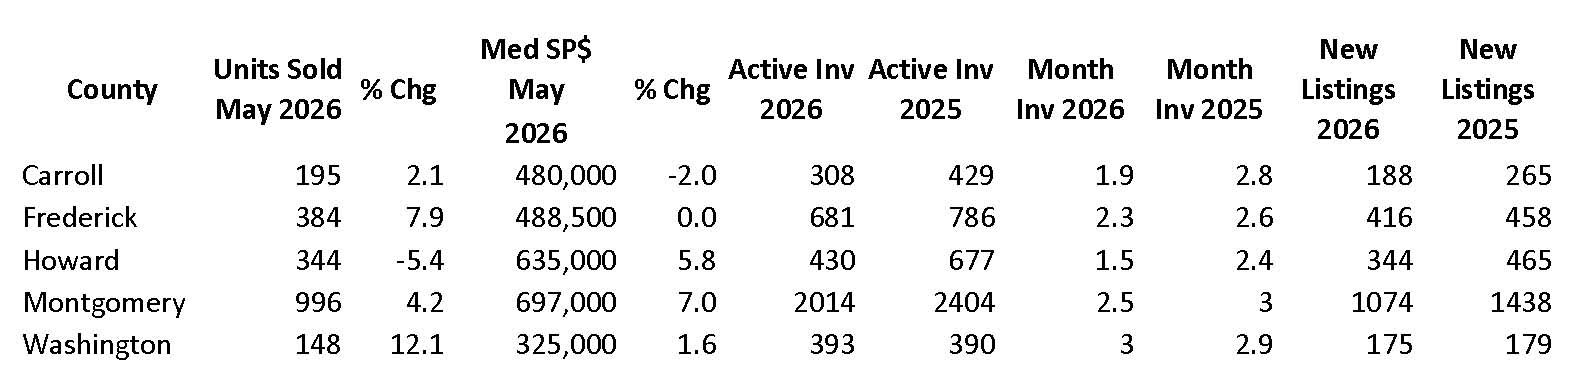
In June 2026 we completed our first UAD 3.6 appraisal. This was a 1 year+ transition for us. We changed forms software, hardware, lidar provider, mobile software, as well as stats and support apps. Although we are not as efficient as our prior processes, we are improving daily while embracing modernization. It will be interesting to review 3.6 results in our August and October Updates. Our overall appraisal volume is up significantly as Q1 volume was our highest in four years. Thanks to all our Clients who provided the opportunities for us to get it done. Our local market can best be described as two-tiered. The higher priced end of almost every area has low inventory and rising prices, and the lower priced end has seen demand drop significantly as inventory exceeds demand. For example, the median SP$ for the state is $454,000 while the average SP$ is $547,405 supporting the two-tiered market with higher priced activity significantly (23% variance) impacting these numbers. This is further supported by the above Counties where the higher priced Counties saw higher increasing SP$, while the lower priced Counites were marginally up to decreasing. We prefer to use the median SP$ as this better reflects the true activity; however, we do look at both in our analysis. There has been much news regarding AI, MLSs, brokers, lenders, listings, and portals and their conflicting competition to aggregate and control listings and data. Much of this has focused on these companies and their revenues/profits while the consumer is almost not considered. In the end, the consumer always wins, and they want an easy, less costly, efficient home buying/selling process. The company that recognizes this and delivers it will win (but who?). Given fraud and other negative factors, people will always be involved in and guide the process; however, it will not be the company that offers the one-stop experience, but the one that delivers an efficient, low cost, consistent, trustworthy process at scale while remembering that real estate is local will capture this market. Locally, default and foreclosure activity is very low but negative signs are brewing, especially in recently built homes (1-5 years old) where the current owner is close if not already underwater and HECMs (reverse mortgages) where we see more default appraisals. Interesting to see how little impact interest rates have on real estate sales activity and prices. We’ve been saying for a long time that it’s an affordability (price and income) not an interest rate issue
Source: Bright MLS and Associated State, Local RE Boards, HousingWire, RIS Media June 28, 2026
The GSEs announced that they will require appraisals to contain a Market Area analysis to support time adjustments and market conditions in Q1 2025. This does NOT have to be complex or time consuming, but that does not minimalize its importance. We have been providing similar information in every report since 2020 (see below). We are not statistical or analytics experts. However, one of the most important roles of the local appraiser is to provide data and comment on local market stats and trends. A robot can pull the data and provide the stats, but only the local pro can reconcile the data and guide the reader to see the issue(s). A doctor returning an x-ray or scan from a technician, and not providing an interpretation is worthless to the patient.